Showing posts with label Weekly News Letter. Show all posts

Tuesday, 22 August 2017

Is Geopolitics Dictating the Markets?

Hope you had a great weekend. The NASDAQ swung lower on Friday, as did the all of the major averages.  Investors and brokerage firms all over the world over were shocked to see over the past several days as the colorful lines on their screens did the unthinkable: they sloped downward and to the right while the VIX did something it completely unexpected: it went up.

The cause for the sudden reversal of fortunes was undoubtedly the escalating rhetoric between Donald Trump and Kim Jong-Un.   In other words, geopolitics came calling.

Global central banks have printed more money than most people are capable of financial assets have been inoculated.

The transmission mechanism for these funds to financial markets is remarkably straight-forward: policymakers engineer a shortage of purchasable securities and that begins by driving yields on the safest of assets to punitive levels. So this works on both the supply and the demand side. You simply reduce supply by buying up assets, and this results in engineering a demand for yield. In more extreme cases, the net supply of securities becomes negative.

So the great question is (or at least for investors) is whether that powerful technical can withstand extreme political shifts. So far, political tsunamis  “the likes of which the world has never seen” (to use a Trump Euphemism) have been overwhelmed by central bank liquidity.

This week, we might have seen the first sign that central banks have reached a limit in terms of their ability to offset geopolitical/policy uncertainty.

Here is what the chart for the Nasdaq and Dow look like.

In the meantime, we’ve got a brand new idea today; one we think should do well over the next several weeks and beyond. When it comes to diversified utilities, they literally don’t get any better than Brookfield Infrastructure Partners.

The company has a global empire of high-quality, cash-rich assets, and the world’s best management team.

Wednesday, 9 August 2017

As we looked back at the record setting week…

As we looked back at the record setting week that was, the analyst team came in to the office this weekend and over a few beers sought figure out what constitutes a fair P/E multiple for the current S&P 500, and figure out if there is any sort of correlation between the amount of currency in circulation and the above historic average P/E multiples that investors and traders are currently willing to pay for stocks.   Yes we agree that as we write this that it sounds much less fun than we intended but this is what we live for.

We are sure that many of you have noticed that from the beginning of the year, there seems to be a disconnect between the optimism provided by soft data, and the negative to stagnant signals provided by hard data (we know that is a general statement), particularly in when we look at retail, automobile, and housing markets.

We note that the S&P 500 P/E ratio sat at 24.2x as of July 1, the question is whether irrational exuberance has stepped into the driver’s seat, or if there is legitimacy to current market expectations. So as we opened our second beer, someone also brought up the theory that increased levels of currency warrant higher trading multiples by devaluing how much earnings are worth to a single investor and also increasing the means to invest, rendering a value comparison to Ben Graham era P/E ratios useless.  Yes exciting stuff.

So its safe to assume that easy credit policies and Quantitative Easing have contributed to a price increase of real assets and consumer goods, but if we drill down we want to see how this relates to the price investors are willing to on corporate earnings.

So our first move was to collect data on the amount of M1 (funds readily available for spending), monthly values for the S&P 500, historical Price/Earinings for the S&P 500, historical monthly volume for the S&P 500, and monthly trailing-twelve month Earnings Per Share for the S&P 500.
Our first move was to compare M1 and P/E, to see if the money investors are readily able to pour into the stock market had some sort of material impact on investor demand for earnings.

The problem with this comparison is that M1 is always increasing (Hey Janet keep the printing press banging on), on the other hand P/E tends to be more volatile due to its many other input factors.

When the gears of the economy stop grinding and earnings collapse, P/E ratios explode because stock prices don’t fall proportionately, but high P/E ratios can also signify high expectations of growth or stability, so this graph in itself didn’t tell us as much as we would have liked.

Next we took a look at the relationship between the annual change in M1 and the average yearly P/E ratios and found something interesting:

Tuesday, 6 June 2017

Markets Start New Week Modestly – Oil and Gold Move Lower

We could end up getting some fundamental change from the Trump camp regarding the space, but even that remains to be seen yet. However, regardless of what does end up happening, we’re still convinced once we have better visibility of the space as the new administration starts to work things out, the removal of uncertainty should help those sectors.
Yet Friday, the biotech space was among some of the weaker sectors. All pretty normal, and once again proving although we do see value opportunity in the space, we’re not going to get too aggressive there until we get something far more definitive – either fundamentally or technically.

The bottom line is we’re still looking for a move to roughly 6,300 on the NASDAQ before we’ll re-assess its longer-term landscape again. It’s going to be more of how we get there than it will be just getting there.

As for oil and gold, both are moving lower in early trading this morning, and we’re still convinced both are headed even lower when it’s all said done.

There’s still an outside chance of a move in light crude to roughly $37, which would clearly be enough to rattle the energy space around those levels, while gold still hasn’t proved its found its ultimate bottom yet.

Wednesday, 31 May 2017

Sectors to Lead Next Big Market Move – Oil Breaks Down and Gold Rallies

A few sectors we continue to find attractive in terms of value and opportunity over the next few years are the pharma and healthcare space. At some point likely sooner, rather than later, these sectors will get a substantial lift. However, this is precisely the type of thing that can drive contrarian investors absolutely crazy in the interim.

We have what many might consider to be a bit of an odd analysis when it comes to the space. Basically, a fund manager asked us what we thought about Gilead Sciences, Inc. (GILD) several months ago. We told him the stock still had much more downside ahead, and that when it hit a certain level, it could coincide with a potential long-term reversal in the space.

Why? Because Gilead is one of those hundred pound gorillas that tends to help or hurt a specific sector. Well, provided below is a long-term monthly chart of the stock, and we’ve been saying for a long time – pay attention to a break below $60 per share. When that happens, not only will Gilead be another excellent long-term buy, so will the entire pharma and healthcare space.

That’s very leading in nature, and although we haven’t mentioned it here, now’s probably the time for everyone to put GILD on their watch list, and look for that break below $60, because if and when we can get it, we’re probably going to lean on the space a heck of a lot more than we have in recent years.

Even biotech is starting to look pretty attractive again, evidenced in this monthly chart of BIB below, the primary ETF tracking the entire biotech space. It too could be trying to develop a bottom right now. Sell side volumes appear to be drying up, which you can see here, and considering there’s got to be other sectors to eventually take these markets higher, maybe it’s going to be all of the above.

Still a little too soon to tell, but that’s what we do here – provide you with as much accurate leading analysis as we possibly can. So keep the above in the back of your mind – as we look to try and take advantage of some sectors Wall Street has probably been working to accumulate for a while now.

It’s a classic scenario – they tell you they hate something until they’re done buying it all up. Then, they’ll come up with upgrade after upgrade. The same thing is going to happen with energy stocks at some point too. Give it some time, every sector eventually comes roaring back.

Tuesday, 30 May 2017

Bears Make a Stand – Bonds Say They’ll Fail

With that, we continue to hunt for value across several sectors, none of which have really broken out to the upside in recent days, other than eSports and cloud computing stocks, but we wouldn’t necessarily consider those sectors to be offering any real value right now. 

There’s no question we missed a very big move in many of those stocks, however, if you’ve been around long enough then you know they’ll come back to us at some point.

As a matter of fact, many of those names are priced out to lunch right now, so the bottom line is we’re currently opting for a little patience in anticipation of a re-pricing of many of those names once these markets do finally decide to stall.

Although these markets do still have every right to move higher, they’re still struggling to breakout with any sort of conviction. Even the NASDAQ Composite, which continues to lead this multi-year rally higher, hasn’t been able to break new ground yet despite late last week’s snapback reversal.

As you can see here, although the index did have three tremendous days leading up to yesterday, sellers continue to jump on the recent strength over the last few days. Truth is, we’re just not going to chase anything to aggressively higher right now. At least not until the S&P 500 and the DOW want to really to start picking it up.

We suspect the markets could still pull back a little, keeping traders on both sides of the trades honest, especially with the declining volume we’ve seen on the NASDAQ since the index bottomed out last week. That’s at least a little concerning, especially since volumes as a whole to continue to somewhat wane.

Tuesday, 23 May 2017

Potential Bottom Developing In Copper – Oil Update and the Russell 2000

What we’re saying here is if the Russell is any indication of the long-term landscape, these markets are NOT in the process of developing an extremely long-term top. Sure, we might get lower levels from here, but there’s just not enough volatility on the monthly charts to suggest a major developing top.
 
That’s good news for those of you who are looking to increase exposure in the months ahead, or for those of you just getting into the markets now. Although a little patience could go a long way right now, we do think the markets are going to end up going higher again when it’s all said and done.

On the commodity front, oil is seeing strength, which probably has a lot of oil bears a little frustrated. We’re not referring to our recent call for a reversal in oil back to the downside, but we are referring to those oil bears who continue to buy the headlines about building inventories and softening demand.

We’ve always been extremely skeptical about oil inventories etc. as it always seems to be a bit of a puppeteering game, but we do still believe oil should move lower now that it has found its way to $50 per barrel. We’re not saying oil’s moving dramatically lower on long-term basis, but we are saying it could be on the verge of a nice short-term reversal soon.

One commodity that has definitely resurfaced from a bullish technical perspective right now though is copper – and with our currently long Freeport-McMoRan Inc. (FCX), it’s entirely possible both of these stock and the more industrial precious metal could start trading substantially higher from current levels.

As you can see in this monthly chart of COPX, the primary ETF tracking the price of copper found its way thrusting above its 3X3 DMA (blue line) for pretty much all of 2016 and into early 2017. Since then, it has pulled back to its 3X3 DMA, but the 3X3 DMA did recently cross the 25X5 DMA (purple line), which can often be an early sign of developing strength.

Basically, we’ve got a number of solid technical reasons here to suggest a potential reversal in copper from current levels. As a matter of strong opinion, we’d be extremely surprised if copper didn’t start trading much better very soon.

The bottom line is any developing strength in copper soon should help FCX. No guarantees, but we do still like the long-term valuation metrics for FCX, and we definitely don’t think the demand for copper is going to wane anytime soon.

Friday, 19 May 2017

Short-Term Buy JetBlue Airways (JBLU) – Oil Achieves Target

The bottom line is at this point, it “looks” as if all of the major indices are headed higher. Whether or not oil and energy stocks are going to participate remains a question right now though, so it’s probably best to continue to pretty much stay away from energy stocks until we get a little more definitive direction.

Although the game of oil production continues to be a driver for the commodity right now, the long-term landscape still doesn’t suggest a strong bullish tone to us.

With that, we’re going to add another short-term trading idea to our list today in Jet Blue (JBLU) in an effort to take advantage of a potential oil selloff, while at the same time providing ourselves with bullish exposure to what we believe to be one of the better airline stocks out there.

As you can see in this daily chart of JBLU below, the stock has pulled back to a key retracement level and appears to be bouncing right around its 50 day moving average (green line). Assuming it picks it up around current levels, the risk/reward here looks pretty good, especially if oil can reverse its recent bullish momentum, and more importantly start trading much lower again.

This also comes as we enter the biggest travel season of the year, so we’ll go ahead and add JBLU around current levels. We’ll set our initial SSL at $20 per share, which is just behind another key retracement level, and we’ll set our target at $24.99, which represents a key expansion level based on its last few months of trading waves.

Further, Energous has had a few very exciting news events over the last few months

Just last month the Company’s WattUp(R) won GOLD for its innovation at the Edison Awards. That’s a pretty big deal, because being recognized with an Edison Award has become one of the highest accolades a company can receive in the name of innovation and business.
Secondly, just ten days ago, the Company announced it has received Federal Communications Commission (FCC) approval of an advanced Near Field WattUp transmitter reference design. The updated transmitter is based on the recently announced DA4100 WattUp wireless power transmitter chip, which is made available through the company’s strategic partner, Dialog Semiconductor.

The DA4100 integrates multiple discrete components into a single silicon chip, reducing cost and implementation footprint, making an ideal in-the-box charging solution for many of today’s small electronic devices.

“This next generation Near Field transmitter reference design continues to advance the WattUp competitive advantages for small form factor and IoT devices with substantially lower bill of materials costs and a smaller footprint directly resulting from higher levels of system integration,” said Stephen Rizzone, Energous president and CEO.

That last line gives you just a few indications of Energous’ possibilities, and although there’s always an inherent risk associated with small stocks like this, WATT is one we definitely think is worth having “some” exposure to for the long haul.

Third, was the Company’s quarterly report just two days ago, and although the Company did lose $.57 cents per share on revenue of just $575K, the Company is projected to grow revenue next quarter by as much as 800%, over 600% year-over-year, and over 400% from this year to next.

As you can see, with the Company’s recent approval coming from the FCC, it should now be in position to start ramping up their revenue on a go-forward basis based on current projections.
Additionally, President and CEO, Stephen R. Rizzone said, “Energous is making substantial headway toward the successful commercialization of power at a distance.

The number of customers in the final stages of WattUp integration is growing rapidly, and consumer availability of these products is expected later this year. Demand for our technology is very high, progress with strategic partners continues to advance, and we are moving quickly to complete formal testing of our Mid Field power-at-a-distance transmitter to secure regulatory certification.

Technically, the stock has been on a bit of a tear over the last few days, so a short-term pullback would be no surprise. However, when we drill down into the monthly chart of WATT, we find the recent railroad tracks extremely attractive there. Meaning, last month’s red down bar has been matched by this month’s green bar back to the upside. At least so far anyway.

Adding Energous Corporation (WATT) – Markets Stall for Now

Good day everyone. We got an increase in CPI this morning (Consumer Price Index) of .2% for April after a .3% decline in March. The index for all items less food and energy rose 0.1% in April after declining 0.1% in March. This may finally start to reflect the early stages of reflation – especially after yesterday’s PPI (Producer Price Index) rise of .5% for April after a .1% decline in March.

One month does not a trend make, but considering how PPI and CPI have been over the last few months, we suspect yesterday and today’s anticipated data is what helped the markets move higher by day’s end yesterday. The move was not only impressive, it once again proved naysayers can’t simply jump in front of any short-term weakness.

The daily chart of the NASDAQ Composite here is a perfect example of what took place by day’s end yesterday. As you can see, the index moved lower for the good part of the day, only to come roaring back by day’s end. However, you can also see the index still made a lower high when compared to the previous two days of trading activity. Yet, the index still has every right to buck the series of lower highs as soon as today. We’ll see.

In the meantime, we’ve got a brand new trading idea, one we’re actually pretty excited about. It doesn’t come without some risk, but this is precisely the type of play that could end up being a nice little homerun someday. And, based on what we just heard from the Company, we could be entering into this specific idea at the right inflection point.

Energous Corporation (WATT) is the developer of WattUp(R)-an award-winning, wire-free charging technology that will transform the way consumers and industries charge and power electronic devices at home, in the office, in the car and beyond. Read our report on WATT here.

It’s a revolutionary radio frequency (RF) based charging solution that delivers intelligent, scalable power via radio bands, similar to a Wi-Fi router. WattUp differs from older wireless charging systems in that it delivers power at a distance, to multiple devices – thus resulting in a wire-free experience that saves users from having to plug in their devices.

Basically, if Energous’ proprietary technology receives massive adoption, it’s going to change the mobile device world forever. We all know everyone’s technical lifeblood these days is dependent on a mobile phone charge. Looking for a plug-in somewhere, fighting over iPhone charger chords. You name it. Lose a charge, and everyone from kids to their parents are freaking out.

Although the Company is expected to continue to lose money into the foreseeable future, if its technology gains adoption, and more importantly its potential growth starts to take hold, its current share price of just over $15 per share may end up being a gift at some point down the road.

A pure small cap play with a market cap of $317M, Energous has over $31M in cash on the books and no debt. There’s no question its next several quarters are likely to chew away at its cash reserves, unless of course Management’s revenue and earnings projections start to take hold.

Friday, 12 May 2017

Oil Rallies As Suspected – Markets Hunt for Direction

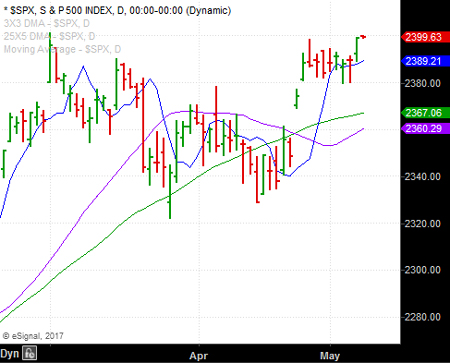
The markets love to keep short-term traders honest these days, so a pullback first would keep both sides of the trade pretty honest. Meaning, if the major indices start to pullback, the move “could” suggest the beginning of a move back to the lower end of the S&P 500′s range, which sits down around 2,325. 
Conversely, it also puts the index in a position to pause at any point over the next several days, and start working its way on to new highs from there.

If the markets are going to pullback and pause, the most logical levels for it to happen on the S&P 500 would be somewhere around 2,367 to 2,360. That’s where both the 50 day simple moving (green line) and the 25X5 DMA (purple line) currently sit on the daily chart here.

The bottom line is these markets still have every technical right to move higher, so we’re assuming those two levels on the S&P 500 will be fairly pivotal toward determining if they’ll want to go higher or simply go range bound on us.

As for gold, let’s just say oil’s reversal on Friday was far and away the more impressive move. Gold still appears to be a little suspect at this point, and although we do still anticipate at least a relief rally soon, it’s clearly not out of the woods quite yet. It’s holding its own for the time being, but there’s going to need to be some sort of technical or fundamental event to strongly suggest a reversal from current levels is in the cards.

At this point, there really isn’t any big reason to run out and make any substantial moves. Let’s see how things play out over the next few days before we have a look at either increasing our long positions or further lightening the load – and potentially even get short a few ideas.

Wednesday, 19 April 2017

APOG Beats and Sells Off – Major Indices Get Major Test… Again.

First, we got some great earnings from one of our open long-term ideas in Apogee Enterprises, Inc. (APOG) on Thursday, but despite the record results, the stock sold off on the heels of the Company’s earnings report. It wasn’t the backwards looking numbers that seemed to spook investors, as much as it was the forward guidance. However, to be perfectly honest, we’re not so convinced the forward guidance is as bad as some are making it out to be.
Apogee said it expects to see revenue climb by 10% from fiscal 2017 levels, which works out to between $3.35 and $3.55 per share in earnings. Those assumptions are based on expectations for industry conditions that include mid-single-digit percentage growth in the U.S. commercial construction market. But, are they pricing in the possibility of expanded infrastructure growth here at home over the next several years? We don’t think so.

The bottom line is although APOG sold off on last week’s news, we’re going to stick with it for now. Investors can’t always expect to catch every idea perfectly at the right time, especially when it comes to good quality companies on a long-term basis. However, we have and continue to like APOG for the long haul. Let’s just hope the Street views the recent selloff as another great buying opportunity in the stock.

As for the broader markets, we’ve been referencing the brewing weakness for quite some time now. As a matter of fact, we first started talking about the issue back in early March, which interestingly enough was the last time the DOW and the S&P 500 made new all-time highs.

Furthermore, it was also the last time we suggested entering into a new idea – and coincidentally enough, one of those new picks was Apogee Enterprises, Inc. (APOG).

Tuesday, 11 April 2017

Trading 101 – Don’t Bet Against the Markets Until the Markets Bet Against Themselves

See all of those arrows? It’s like chipping and chipping away at an icy fishing hole in the dead of winter. Eventually it’s going to crack, and that’s what appears to be happening so far on the day. It’s what happens on the potential upside crack that’s going to be far more meaningful.
Here’s the takeaway today with respect to the overall market landscape on a near-term basis; there’s no guarantee the NASDAQ is going to make that new high today. However, we are fairly certain – based on what we’re seeing on the daily and weekly charts – that these markets are NOT in the process of topping out right now.

Could they move lower from where they’re at now? Sure, but we just don’t think we’re on the verge of that major selloff everyone keeps talking about. It is possible these markets may need to back up one more time before they do finally make a big move higher, but unless something seriously changes, we just don’t think we’re going to get the big selloff so many continue to anticipate.

At the point the markets confirm something significant, we can always adopt a firm bearish stance. However, as evidenced by all of our open ideas right now, we’re just not ready to make that big market bet on a big reversal just yet. We’ve been close to making that big bet on a few occasions, but have yet to pull that trigger.

So, it’s still all systems go to the upside until proven otherwise. It would just be a lot nicer to see some of our longer-term ideas start performing a little better, but at least we’re in the green on nine of our twelve open ideas, and the green still far outweighs the red. Let’s hope it continues to stay that way.

Trading 101 – Don’t Bet Against the Markets Until the Markets Bet Against Themselves

See what we mean? How on earth can anyone bet against these markets right now with any sort of comfort or confidence. It’s just not possible. And, based on what we’re seeing so far this morning, it sure “looks” like we could be on the verge of more upside ahead, however, we’ve got some fairly interesting analysis for you – more on that in a second.
Yesterday’s trading activity did provide some late day clues to this morning’s move higher, as the markets kicked off trading yesterday to the downside, but by day’s end the markets had come roaring back yet again. Surprised? Don’t be. That’s just how they continue to behave these days.

More importantly, if the weekly chart of the NASDAQ is any indication of what’s to come, we could be in for an extremely sharp move higher now. We said this week could prove feast or famine for the markets on a near-term basis. Well, if it’s going to be feast, we’ll need not only a slight new all-time high – even if it’s just on an intra-day basis – we’ll need serious follow through. Here’s why…

Provided below is a weekly chart of the NASDAQ. We said on Monday we suspected the index would pull back this week. It did. However, the pullback stalled right on the 3X3 DMA (blue line), which we’ve pointed to here.

Now, it found its way back up against its recent highs, so considering we got the pullback it needed, where it stalled, and the fact it now appears to be working its way higher, it sure looks like we could finish the week on a strong note – especially since we’ve had so much volatility in recent days.

But, when you look at what happened in late August and the first week of September of last year, you can see the index did the exact same thing it’s done over the last several weeks… grind around, break down, snap back and grind around some more. If, and the big word is “IF”, the NASDAQ makes that slight new all-time high today or at any point this week, and breaks down miserably, we could be headed much lower.

With yesterday clearly being another one of those all-important Tuesdays, the markets proved once again they may just not be ready to break down on a short-term basis yet – especially when you break down the daily chart of the NASDAQ. As you can see, after days and days of back and forth index ETF swapping, the markets now appear to be in for another sharp leg up.

Friday, 7 April 2017

Weekly Chart of the NASDAQ Will Reveal Near-Term Future

Hope your weekend was a good one. We’ve got the markets waffling to kick off April, which should come as no surprise considering the volatility we’ve seen in both directions over the last few weeks. But, like we’ve seen on every single occasion for about six years now, when it’s time, the plunge protection team comes in and saves the long-term bulls.
It’s almost like clockwork, and it’s almost eerie. However, we can simply chalk it up to somewhat low volumes, extremely bullish long-term technical, and a somewhat better economy than we’ve seen in quite some time.

Basically, when we couple an extremely dovish interest rate environment with all of the above, it’s a perfect recipe for a classic market melt-up, one we’re not going to bet against much until we strongly believe it’s time, but that time has yet to come.

Sure, we’re on record in recent years on more than a few occasions pointing to the “possibility” of a short-term selloff, and often calling them accurately, but we have yet – in six years- to suggest this long-term bull market is anywhere close to being over.

That’s just the reality, and until we start to see significant volatility in both directions on the long-term charts, we still strongly believe these markets are headed higher.

How much higher and the time frames associated with those higher levels are obviously the bigger questions for the markets. So, let’s have a look today at what the near-term landscape may offer equities.

The weekly chart of the NASDAQ Composite is still going to be the most telling for the near-term, which is provided below. Interestingly enough, although we definitely don’t think the long-term bull is going away anytime soon, the last two bars on the weekly chart here have gotten longer than anything we’ve seen since the end of last year.

Thursday, 30 March 2017

Baby Bear Surfaces for Now – Likely Won’t Last Long

Like we also said Friday, with the NASDAQ having failed to close at or above 5,851, there’s a much higher probability now we could be looking at a few more weeks of downside ahead. Keep in mind, anything can happen on an intra-day basis, but at this point it would really surprise if these markets found a bottom today that will last. Sure, it could bottom where it opened this morning, but at this point even if the markets rally off their lows, we don’t expect it to last.

Precious metals are the clear winners on the day today, and it sure continues to look like there’s plenty more upside ahead for gold. It’s likely not to come without a fair amount of volatility along the way,  but there’s a good chance we could see another 20% or so of further upside ahead in UGLD, the primary bullish leveraged gold ETF, before it could be in a position to finally pull back.

There’s one very glaring surprise this morning, especially when you consider the negative impact we’ve seen on pharma coming from the Trump camp lately. With all of the uncertainty surrounding healthcare and the pharma space this morning, pharma is actually among the very few green sectors so far on the day.

Honestly, we figured pharma would get crushed on the open this morning, but it’s actually slightly green, which is a gift with today’s sharp move lower across all of the major indices. This continues to suggest value in pharma on a long-term basis around current levels.

If you’re looking to get short the major index ETF’s, or play some index ETF put options a month or two out for protection, we’d suggest waiting for now, unless of course you entered on Friday when you saw the NASDAQ wasn’t going to close above that 5,851 level.

Considering where these markets opened this morning, it would be no surprise to see them rally off early morning lows today, and maybe even into tomorrow. It would be at that point the risk/reward for a potential short trade would be much better.

Wednesday, 29 March 2017

NASDAQ Update – Commodities and the Dollar

We’re going to have a look at the dollar today, something that should continue to help commodities, as it appears our currency could be in the early stages of a longer-term decline. Provided below is a weekly chart of the U.S. Dollar Index, and as you can see, it continues to find its way below its 3X3 DMA (blue). That’s not a good sign for the dollar on a near-term basis.

It doesn’t mean it’s going down in a straight line, but based on what we’re seeing here, it sure continues to look like a sell the rips and buy the dips scenario. And, it’s important for everyone to remember part of Trump’s plan throughout his entire campaign was to win the currency war with respect to foreign trade. In other words, he continued to blame foreign countries for de-basing their currency to help their exports, something that likely appears to be in the early stages here at home now.

This brings us to gold now. Provided below is an isolated weekly chart of GLD, the primary ETF tracking the price of gold, along with all of the moving averages we like to use, both displaced and simple moving averages. As you can see, we’ve circled what looks to be an extremely major battle of the averages right now. Meaning, they’re all converging to almost a single point. You won’t see that very often on any chart. Look around and you’ll see what we’re referring to.

You can also see the first time it appeared GLD was going to break above its 200 day simple moving average recently (orange line), it failed. However, it looks to be gunning for that major average again, all while we could be getting some follow through on some nice recent technical crosses. If that ends up being the case, it’s very possible gold could be in for much higher levels ahead, which would continue to suggest nice returns in a bullish leveraged gold vehicle like UGLD.

What’s the takeaway today? It appears gold continues to be worth owning, and we definitely think there isn’t all that much more downside left for commodities as a whole on a long-term basis. There’s no question stocks are still the place to be right now, but commodities do continue to look pretty attractive for the long haul based on we continue to see take place from both a technical and fundamental perspective.

NASDAQ Update – Commodities and the Dollar

It’s been a week, and although Congress is back to their normal delayed ways by pushing the healthcare vote forward another day, the markets wait for no one. We got more modest movement following Tuesday’s sharp decline, with the end result being a bit of a mixed bag.
More importantly today, we’ll see if the NASDAQ can somehow muster enough strength to close at or above the all-important 3X3 DMA on its weekly chart of 5,851. Provided below is a weekly chart of the NASDAQ Composite showing you what we’re referring to. As you can sort of see, the 3X3 DMA (blue line) sits at that 5,851 number.

Basically, should the index somehow fail to close at or above 5,851 today, the technical event would suggest a stronger possibility of a few more weeks of downside ahead, which as far as we’re concerned would actually be a welcomed event. These markets have clearly needed a breather for quite some time, so the event would likely help give equities better technical context for a more sustained bull market in the months ahead.

That may sound a little contrary, but the last thing long-term bulls want to see right now is a runaway freight train to the upside, as that would actually be the first sign of a developing long-term top. It’s only a matter of time before one develops, but based on the way things have been shaping up of late, that possibility still remains slim for the time being.

The bottom line is it’s still all systems go on a long-term basis for stocks. It’s more a matter of where they’ll settle before they finally do decide to resume their longer-term trend higher. Commodities, on the other hand, continue to paint somewhat of an interesting picture.

Oil continues to hang in there following that sharp decline a few weeks back, and although it continues to struggle, it still hasn’t managed to close below last week’s low, which you can see on the daily chart below. It’s breached it on an intra-day basis, but it hasn’t closed below it. However, if it can’t hold its early morning gains, it does appear it could be in for another leg down. We’ll just have to see how it plays out  into early next week.

Regardless, we still don’t believe oil has all that much more downside ahead, despite all of the inventory rhetoric that continues to surface, because the reality is inventories can be manipulated by the powers that be at any point in time if they want to. They’ve done it before, and they’ll likely do it again.

Monday, 27 March 2017

It Was Bound to Happen – Experience Speaks

As for the banks, they’ve led these markets higher for quite some time, so when everyone started piling into the markets on the failed reversal signal early last week, which continued into yesterday when the NASDAQ took out another new intra-day high, the markets basically started to unwind what was likely an overly crowded trade of sorts. 

In other words, too many reckless bulls just started piling into the markets, and the markets love to make fools of those who pile into overly crowded trades.

So where could these markets be headed? When it’s all said and done, we still suspect much higher. That could start developing as soon as today, at any point over the next several days, or possibly even weeks, it’s still too soon to tell. It’s hard to know at this point, but one thing’s for sure – in the event they do continue lower, we think we’ve got a pretty good bead on where they may be headed.

Provided below is daily chart of the NASDAQ Composite, along with some key retracement levels dating back to that key election bottom and this week’s new intra-day high. As you can see, there’s two 3/8th’s retracement levels in green sitting at 5,719 and 5,666.

Those are both possible support levels. However, should these markets really start to pick up steam to the downside, it’s the 5,600 level we’ve pointed to here that should be the big line in the sand, a level worth getting back into the index ETF long trade, as well as a level to averaged down in some of your more quality names, and possibly add some new names.

We’re clearly not at any of those three levels now, or even close to them for that matter, which is why we’re just going to suggest sitting tight for the time being.

Should these markets find their footing without ever testing any of the above mentioned levels, and more importantly find new highs, then what happened yesterday will have meant nothing.

Conversely, should these markets simply continue lower, we’re clearly not going to want to step in the way until they’ve achieved what we believe to be a key technical bottom.

It Was Bound to Happen – Experience Speaks

If there’s anything we’ve learned about these markets over the last several years, it’s that they’re capable of anything. We’ve also learned to expect a dramatic move when one would least expect it. Yesterday’s reversal was about as indiscriminate as anything we’ve seen since just before the election, and it came at a time very few expected it.

However, if you follow the markets daily activity as closely as we do, then you’ve probably come to learn these markets have had a very consistent habit of breaking down on new highs, but which new highs has always been the question. Truth is, sometimes these markets have broken down on new highs and sometimes they haven’t, but one thing’s for sure – when they have reversed themselves sharply, it has usually always come when the bulls start to get a little too giddy.

That last comment right there has been one of the single biggest reasons many traders have hated this rally for a very long time. They get aggressively long and the markets break down on a short-term basis. They aggressively short and the markets rally until they’re forced to cover. We have enough bright minds here to know this has been a pretty common theme for quite some time.

This is precisely why we don’t trade aggressively on a short-term basis. Although we clearly don’t think these markets are topping out on a long-term basis yet, they do continue to make pretty big fools out of those who just can’t quite understand how the markets love to play a game of opposites these days.

The bottom line is that was a pretty long winded way of saying we’re not surprised about what took place yesterday. We knew a selloff was coming sooner, rather than later – it just came a little later than we thought it might.

What to do now? Nothing yet. If you’re a swing trader, the move may or may not be over yet, more on that in a second. If you’re a long-term investor, the markets only gave up a few percentage points yesterday, if that, so it’s not as if we should be jumping in guns a blazing and looking to average down in our favorite ideas. More importantly, there’s no reason to jump ship either, especially since we’re exposed to good quality companies that will likely continue to prove themselves over the next several months and beyond.

If there’s one big mistake investors tend to make, it’s jumping ship in good companies just because the markets blow off some much needed steam. It happens all of the time, so don’t be among the sheep. Stay the course in quality ideas until a point in time the markets implode. Then, and only then, average down in those quality ideas.

If you’re timeframes and strategies require much more of a timing mechanism to your efforts, we don’t think yesterday was a long-term top in any way, shape or form. However, the much needed breather could be in for more downside ahead, but let’s not bet on that either right now.

When we dig into yesterday’s move, it was banks, biotech and pharma that led the move lower, three major sectors of the markets we actually like more than most on a long-term basis. Coincidence? No. Pharma and biotech continue to be under heavy speculation with lawmakers and the companies within those sectors still unsure over what’s to come of healthcare legislation, which is set to get underway in congress as soon as tomorrow.

Friday, 24 March 2017

Oil Update and NASDAQ Leads – All Good For Now

The markets are waffling a little to start the week with mixed performance across various sectors, as well as the major indices, but again – we don’t expect any sort of major selloff soon. That failed sell signal early last week was pretty paramount, and although the markets can’t seem to break new ground to the upside yet, the longer they continue to grind sideways like this, the more and more it continues to help the longer-term bullish landscape.

Provided below is a daily chart of both the NASDAQ Composite and the S&P 500, and as you can see, we continue to get that flipping back and forth with no real definitive break out or break down. Not yet anyway. However, you can see the NASDAQ is starting to pick it up a little, while the S&P 500 is under a little pressure this morning.

The bottom line is we’ll need the NASDAQ to lead if these markets are going higher, and it looks like that’s what we’re getting now. Assuming the NASDAQ can find another new all-time high as soon as today, we could be looking at another nice leg up to close out the month. If that happens, we could see NASDAQ 6,000 before the end of April.

More importantly, if these markets don’t take a breather and we do find ourselves at NASDAQ 6,000 by the end of April, that could be just enough bullish thrusting to create an awful lot of cause for concern come May. We’ll just have to see how it all plays out, but based on what we’re seeing right now, it’s sure starting to look like that will be the case.

We’ve got oil moving a bit lower this morning following last week’s stabilization of the commodity. Provided below is a daily chart of light crude, and as you can see, it’s simply pulling back a little following last week’s bottom. The key will be if it can hold last week’s low. Even a slight breach and a rally off that level would be fine too, so we’ll have to keep a close eye and see what happens over the next few days.

Assuming it fills the gap we’ve pointed to here, and more importantly can start working its way higher from there, oil stocks could start behaving much better, and that would most definitely be another feather in the bulls’ caps. However, there’s still no guarantee the commodity has achieved a tradable bottom yet. We’ll just have to see how things play out over the next few days.

Nothing new today. Possibly over the next few days though, let’s just see how these markets behave heading into the close today, because if what we’re seeing right now continues, we’re likely looking at another good week for stocks, and once again another good month when it’s all said and done.